
October was an exciting month for Bay Area real estate buyers and sellers – despite an ongoing pandemic. Five of the hottest counties in the areas reported higher than expected sales in October 2020, showing how the area is continuing to thrive and attract investors from across the country. Although the fact that the number of closed sales in October 2020 was 4% lower than that of October 2019, the increasing rate of sales indicates that the 2020 overall number could exceed that of October 2019 by December.
To understand the investment opportunities in the Bay Area, it’s important to note the income, interest rate, sale price, and other trends in the various counties. From North to South, the five main counties to keep on your radar for the Bay Area are San Mateo, Santa Clara, Santa Cruz, Monterey, and San Benito counties.
Here are some charts to help you follow along:
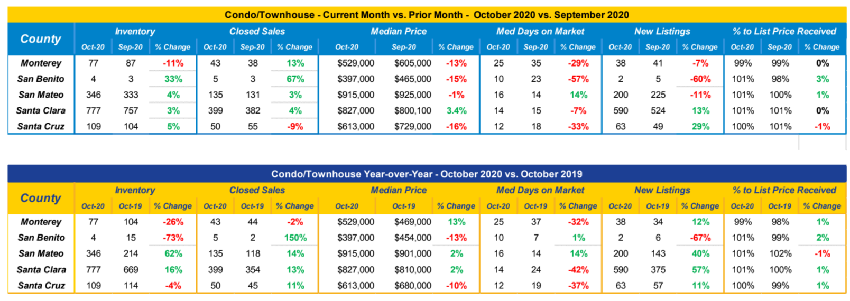
Let’s break them down one-by-one for the month of October 2020.
1. San Mateo County:
Condos & Townhouses
- Based on 135 sales, the median cost for a home was $912,500, sold at 101% of the list price with an average sale period of 16 days.
- In October 2019, there were 214 homes available as compared to the 345 homes available in October 2020, signalling an increase by 61%. Inventory was also up by 4% in October 2020 as compared to September 2020.
- The Average Days on market (DOM) went up by 8% or 2 days, from 25 to 27 days from October 2019 to October 2020.
- New listings in October 2020 went down by 11% when compared to September 2020 and up by 40% compared to October 2019.
- Closed sales went up all around. They increased by 3%, from 131 to 135, when comparing September 2020 to October 2020 and went up by 14% from October 2019.
Single Family Homes
- The median cost for a single family home was $1,684,944 and sold for 103% of the list price in 11 days. This is based on 498 sales in October 2020.
- In October 2019, 660 homes were available compared to 686 homes in October 2020, signaling an increase of 4%. Inventory was down in October 2020 by 3% compared to last month.
- The Average DOM went down from 27 to 22, 5 days, or 19%. The median DOM went down by 1 day in October 2020 as compared to September 2020.
- New listings are up by 33% from October 2019 but down by 2% from the previous month.
- From last month, closed sales went up by 15%, 434 to 498, which was also a 28% increase from October 2019.
2. Santa Clara County
Condos & Townhouses
- Based on 397 sales, the median cost for a home was $828,027, sold at 101% of the list price with an average sale period of 14 days.
- In October 2019, there were 669 homes available as compared to the 776 homes available in October 2020, signalling an increase by 16. Inventory was also up by 3% in October 2020 as compared to September 2020.
- The Average Days on market (DOM) went down by 8% or 2 days, from 31 to 29 days from October 2019 to October 2020.
- New listings in October 2020 went down by 13% when compared to September 2020 and up by 57% compared to October 2019.
- Closed sales went up all around. They increased by 4%, from 382 to 397, when comparing September 2020 to October 2020 and went up by 12% from October 2019.
Single Family Homes
- The median cost for a single family home was $1,450,000 and sold for 103% of the list price in 9 days. This is based on 1072 sales in October 2020.
- In October 2019, 1461 homes were available compared to 1178 homes in October 2020, signaling a decrease of 19%. Inventory was down in October 2020 by 2% compared to last month.
- The Average DOM went down from 24 to 222, 2 days, or 35%. The median DOM did not change in October 2020 as compared to September 2020.
- New listings in October 2020 went up by 2% when compared to September 2020 and up by 44% compared to October 2019.
- Closed sales increased by 8%, from 991 to 1072, when comparing September 2020 to October 2020 and went up by 31% from October 2019.
3. Santa Cruz County
Condos & Townhouses
- Based on 50 sales, the median cost for a home was $613,000, sold at 100% of the list price with an average sale period of 12 days.
- In October 2019, there were 114 homes available as compared to the 109 homes available in October 2020, signalling a decrease by 5. Inventory was also up by 5% in October 2020 as compared to September 2020.
- The Average Days on market (DOM) went down by 36% or 20 days, from 56 to 36 days from October 2019 to October 2020.
- New listings in October 2020 went up by 29% when compared to September 2020 and up by 11% compared to October 2019.
- Closed sales decreased by 9%, from 55 to 50, when comparing September 2020 to October 2020 and went up by 11% from October 2019.
Single Family Homes
- The median cost for a single family home was $1,055,500 and sold for 102% of the list price in 10 days. This is based on 182 sales in October 2020.
- In October 2019, 537 homes were available compared to 352 homes in October 2020, signaling a decrease of 34%. Inventory was up in October 2020 by 9% compared to last month.
- The Average DOM went down from 49 to 34, 15 days, or 31% when compared to October 2019. The median DOM decreased by 2 days in October 2020 as compared to September 2020.
- New listings in October 2020 went up by 19% when compared to September 2020 and up by 33% compared to October 2019.
- Closed sales decreased by 8%, from 198 to 182, when comparing September 2020 to October 2020 and went up by 31% from October 2019.
4. Monterey County
Condos & Townhouses
- Based on 42 sales, the median cost for a home was $549,500, sold at 98% of the list price with an average sale period of 28 days.
- In October 2019, there were 104 homes available as compared to the 78 homes available in October 2020, signalling a decrease by 26. Inventory was also down by 10% in October 2020 as compared to September 2020.
- The Average Days on market (DOM) went up by 7% or 5 days, from 73 to 78 days from October 2019 to October 2020.
- New listings in October 2020 went down by 7% when compared to September 2020 and up by 12% compared to October 2019.
- Closed sales increased by 11%, from 38 to 42, when comparing September 2020 to October 2020 and went down by 5% from October 2019.
Single Family Homes
- The median cost for a single family home was $850,000 and sold for 99% of the list price in 103 days. This is based on 279 sales in October 2020.
- In October 2019, 852 homes were available compared to 571 homes in October 2020, signaling a decrease of 33%. Inventory was down in October 2020 by 34% compared to last month.
- The Average DOM went up from 47 to 52, 5 days, or 11% when compared to October 2019. The median DOM increased by 3 days in October 2020 as compared to September 2020.
- New listings in October 2020 went down by 3% when compared to September 2020 and up by 18% compared to October 2019.
- Closed sales decreased by 7%, from 301 to 279, when comparing September 2020 to October 2020 and went up by 24% from October 2019.
5. San Benito County
Condos & Townhouses
- Based on 5 sales, the median cost for a home was $397,000, sold at 101% of the list price with an average sale period of 10 days.
- In October 2019, there were 15 homes available as compared to the 4 homes available in October 2020, signalling an decrease by 73%. Inventory was also up by 33% in October 2020 as compared to September 2020.
- The Average Days on market (DOM) went down by 88% or 52 days, from 59 to 7 days from October 2019 to October 2020.
- New listings in October 2020 went down by 60% when compared to September 2020 and down by 67% compared to October 2019.
- Closed sales increased by 67%, from 3 to 5, when comparing September 2020 to October 2020 and went up by 150% from October 2019.
Single Family Homes
- The median cost for a single family home was $634,000 and sold for 101% of the list price in 9 days. This is based on 54 sales in October 2020.
- In October 2019, 131 homes were available compared to 116 homes in October 2020, signaling a decrease of 11%. Inventory was up in October 2020 by 8% compared to last month.
- The Average DOM went down from 47 to 37, 10 days, or 21% when compared to October 2019. The median DOM decreased by 4 days in October 2020 as compared to September 2020.
- New listings in October 2020 went up by 40% when compared to September 2020 and up by 33% compared to October 2019.
- Closed sales decreased by 21%, from 68 to 54, when comparing September 2020 to October 2020 and went up by 8% from October 2019.
Ready to take advantage of the next hot property? Head to our Contact Form so we can get started on taking your real estate investing to the next level: